Charts
TakeStock 2 can display charts for most securities.
To display a chart for a position:
- Select the position in the Held or Sold view and click the Chart toolbar button. The Chart window appears.
If you select more than one security, they will be shown in the same window.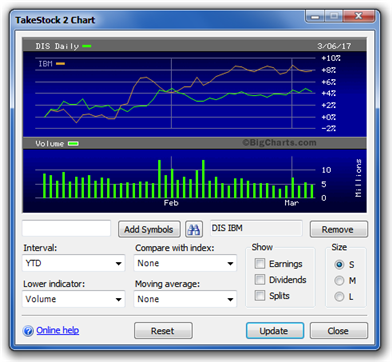
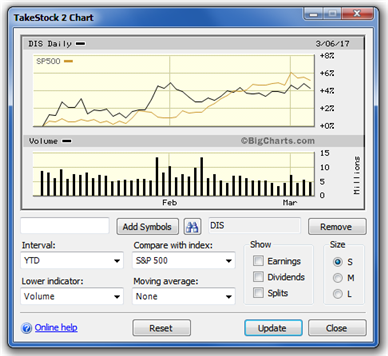
- The chart is highly customizable. You can select:
- The time interval the chart should span (from Intraday to 10 Years).
- The lower indicator to display (Volume, Volume + Gain/Loss, RSI, MACD, Money Flow Index or DMI).
- The index to be compared against (S&P 500, Dow Jones, NASDAQ and Russell 2000).
- The moving average to be overlaid on the chart (from 15 day to 6 month).
- Whether indicators for earnings, dividends or stock splits should be displayed.
- The size of the chart (Small, Medium or Large).
- To add more symbols to the chart, enter them in the box (separated by spaces) and click Add Symbols. If you don't know the symbol, click the Symbol Finder button to find it.
- To remove a symbol, click the symbol and then click Remove.
- You can open multiple Chart windows at the same time.
- Click Close to dismiss the Chart window.
See also:
Created with the Personal Edition of HelpNDoc: Effortlessly Support Your Windows Applications with HelpNDoc's CHM Generation